MelcoRIP has been factory profiled and calibrated to provide accurate color reproduction on the available medias. It does, however, include a calibration feature which can be used to create the calibration files which change output density. The density curves work on a per-color basis.
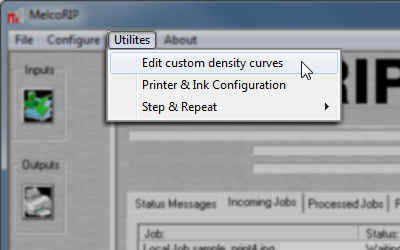
To access the dialog to edit density curves, select “Edit Custom Density Curves” from the “Utilities” menu.
The feature lets you save any number of named curves. All previously defined curves appear in the “Curve Name” drop-down. You can also click the “New” button after typing a name to create a new one.
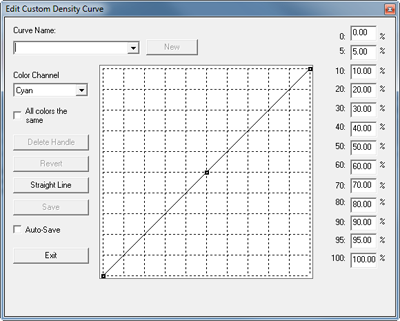
Checking this box will tie all the channels together. All other color channels will become like the currently displayed channel when the box is checked. Also, any subsequent changes to a channel will affect all channels in the same manner.
If this checkbox is not checked, all channels can be edited independently and will retain their individual values.
This drop-down list allows you to switch color channels. If “All colors the same” is checked, all channels will be the same.
Clicking this button will revert the curve to the original values it contained before it was edited.
As you may have noticed, that button turns the curve into a straight line.
NOTE: It is highly recommended that a densitometer or spectro-photometer be used when doing any calibration. Although you can calibrate without one, you would be relying on the human eye, light source, etc which can have many variables.
The calibration user interface enables you to alter the density curves by dragging the graphical line (on the left) or typing the number into the proper box (on the right).
To edit using the graphical line, select a place on the curve where you want to make the change and click. A handle will appear which you can then drag up and down. Create as many handles as necessary to achieve the proper curve. To delete a handle, simply drag it outside the bounds of the grid and it will disappear.
The calibration grid is designed “linearly” and thus 0% (the highlights) is at the bottom left and 100% (the shadows) is on the upper right.
To change the appearance of your printout, drag the curve in the direction you want the density to move. For example if your 50% range is printing too dark, decrease the value at that range by moving the curve down or entering a lower number in the 50% box