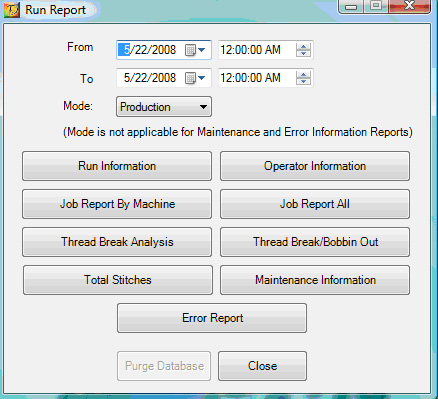
AMAYA OS Reports provide statistical information on various aspects of AMAYA operation. To generate these reports, select Tools->Reports. You will see the following dialog:
Before generating reports, you must select a time frame in this dialog. The time frame consists of a start day and time, and an end day and time. Any data collected by AMAYA OS within the indicated time frame will be output in the generated reports. After entering a time frame, select the reports you wish to run (left-click to check/uncheck the boxes next to the report names). To generate the selected reports, click View Reports.
You can also purge the data in the statistics database by clicking the Purge Database button. This will clear the database of all data collected from the date the database was created to the end date indicated in this dialog.
The following section describes each of the reports that AMAYA OS can generate. Note that all reports containing lists organized by columns can be re-sorted by any field by clicking on the column header. You can also click the Print Report button on any report dialog to print.
The Run Information report lists every design run completed on every machine during the selected time frame. The information listed includes the date and time of the run, the machine serial number, the design name, the number of stitches in the design, and the total time to complete the run.
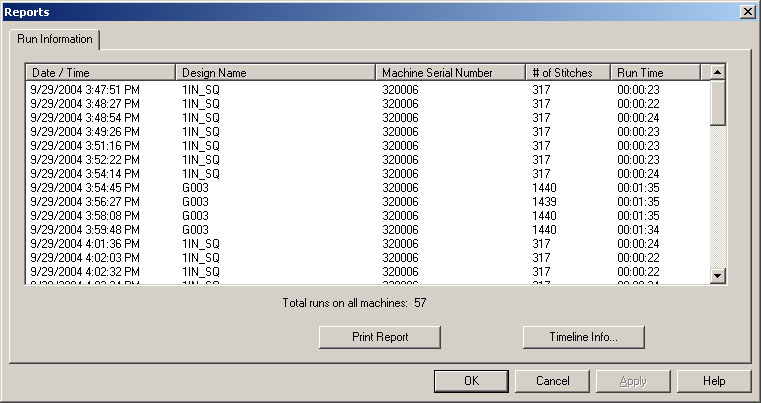
Double-clicking a run’s entry will open an extended information report pertaining to the run.
This report includes the design name, machine serial number, current operator, speed information, start and end times for the run, as well as total stitches in the design, and totals for sewing time, down time and run time. Also included are occurrence counts and average delay times for start/stop, thread breaks, bobbin breaks, color changes, and machine errors. A run productivity percentage is also provided, indicating the percentage of time the machine was actually sewing during this run.
Note: If a Goto Stitch command of 50 or more stitches is detected in a run, this will be indicated in the extended information for that run.
The Job Information report lists each job completed during the time frame selected. A job is defined as consecutive runs of the same design on a particular cluster under a constant configuration. The information in the job list includes the starting date and time, design name, cluster number that the job was run on, and total number of runs during the job.
Double-clicking a job’s entry will open an extended information report pertaining to the job.
The extended information includes the following information: design name, total stitches, current operator, cluster number and configuration information, speed information, and start and end times for the job. Also included is production information such as total runs during the job, stitches sewn, and average runs and stitches per hour. Time information included in the extended report is average run time per head, average load time, average down time and total time to complete the job. Job down time is broken down into the counts and average seconds delay for start/stop, thread breaks, bobbin breaks, color changes, and machine errors. A job productivity rating is calculated as a percentage of time the machines were actually running against the duration of the job.
Note: If a Goto Stitch command of 50 or more stitches is detected in a job, this will be indicated in the extended information for that job.
The Operator Information report lists each time an operator was logged in to AMAYA OS during the requested time frame. The columns contain the date and time of the login, the operator's name, and the number of runs completed by the operator. Initially, each login is represented by its own entry, and the extended information describes only what took place during that session.
Clicking on the Show Totals button will change the display to show only one entry for each operator representing his/her total login time during the requested time frame, and the extended information describes what took place over all sessions for the operator.
The extended information includes the name of the operator, login time and duration, total runs, total stitches sewn, average runs, pieces and stitches per hour by this operator. Also included is sewing time, run time, load time, down time, total operator time, and counts and average seconds delay for start/stop, thread breaks, bobbin breaks, color changes, and machine errors while the operator was logged in. An operator productivity mark is calculated as the percentage of time the machines were sewing while they were available to this operator.
Note: If a Goto Stitch command of 50 or more stitches is detected, this will be indicated in the extended operator information.
The Thread Break Analysis report lists every unique design in the database, along with the number of times that design has been completed and the number of thread breaks incurred while running it.
Double-clicking an entry will bring up extended information about where that design incurred its thread breaks.
The extended report shows the design name, the total number of runs and the number of stitches in the design. The thread break list shows the number of thread breaks that occurred during the job in groups of 25 stitches. If a particular stitch range shows an unusually high number of thread breaks, it indicates a problem with the design that should be corrected.
The Total Stitches report shows the total number of stitches sewn on each machine in the database in the requested time frame.
This report lists every machine serial number that was connected during the selected time frame. For each entry, it shows the total number of stitches sewn for completed designs on the machine, total number of thread breaks and bobbin outs that occurred on the machine, and an average stitches per thread break and bobbin out.
Double-clicking on an entry will launch the thread break by needle report for that machine.
This contains a breakdown of the thread breaks, identifying how many occurred on each needle.
The Maintenance Information report lists every maintenance timer timeout and reset message that has been logged to the database. The report has columns for the date and time of the event, the name of the operator, the machine serial number, and the maintenance message.
The Error Report lists all of the errors that have been logged to the status bar in AMAYA OS. The report has columns displaying the date and time of the error, the machine serial number, and the error text.